UK Manufacturing continues to follow a V shaped recovery as key sectors of the economy re-open evidenced by strong data and a yet another band-aid Brexit solution.
COVD-19 and political uncertainty remain the key themes through 2020 with stock markets projecting valuations to remain relatively flat in the year to come.
Set out below are the current valuations in the sector.

Figure 1: Sector Revenue Multiples
Figure 2: Sector EBITDA Multiples

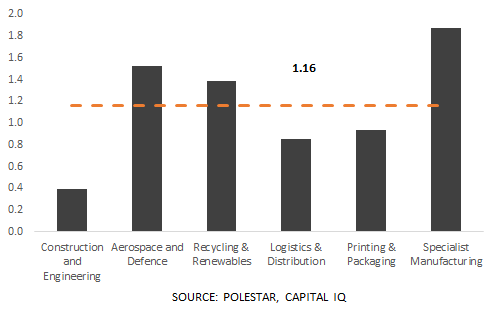
Forward Multiples
Manufacturing production declined 7.1% YoY in Oct-20’, beating forecasts of an 8.1% drop. Still, this comes as the 19th consecutive decline amidst Brexit and COVID-19 induced uncertainty (Source: Office of National Statistics)
Figure 3: Sector Revenue Forward Multiples

On the bright side, the UK manufacturing PMI increased to 57.3 in Dec-20’, well above forecasts of 55.9. These recent flash estimates to the strongest expansion in factory activity since Nov-17’. New orders expanded at the fastest pace since August driven by temporary spikes in purchasing ahead of the looming Brexit deadline. (Source: IHS Markitt)
Figure 4: Sector EBITDA Multiples

Figure 5: Revenue Multiples & Growth Rates

• Industrial technology companies trade at between 2.5-4 revenue multiple and, on average, have achieved 4.37% 3Y CAGR
• At the lower end of the scale, construction and engineering companies are being priced around 0,5x at growth rates of under 0%. Many of the leading organisations have had very challenging years, for example revenues of Costain Group, Galiford Plc and Henry Boot Plc have all contracted by c.20% in the last year
Figure 6: EBITDA Multiples & Margins

• The sample is entirely comprised of public companies which are relatively mature compared to generally smaller, private businesses. Although the correlation between margin and multiples looks to be very clear, it isn’t as straight forward as the equation suggests. As such, when looking at smaller companies, the impact of margin on valuation is often much less noticeable and primarily driven by total addressable market, revenue growth and other qualitative factors
• Industrial technologies are trading up at the top end around 15.1x, on average achieving greater than 10% margins. As is evident from the graph, industrial tech along with specialist manufacturing generally commands a high degree of pricing power through hard-to-replicate intellectual property and with it, higher multiples
• Despite having slightly stronger margins compared to Industrial tech, specialist manufacturing businesses are trading roughly one turn lower (14.1x EBITDA)
Figure 6: Manufacturing Deal Volumes (2020)*

*UK Targets, Under £500m, Mergers, Acquisitions & Buyouts
• Q4-20’ Manufacturing deal volumes reached yearly lows in both deal value and volume compared to previous months.
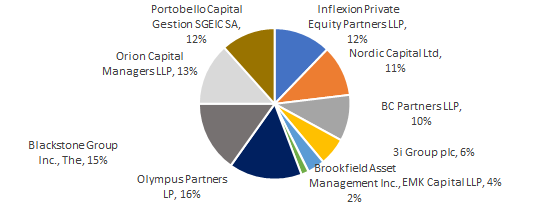
Figure 8: Top Ten Private Equity Acquirers (Past Year)**

**UK Targets, Under £500m, Mergers, Acquisitions & Buyouts
• In the past three years, the top ten private equity buyers have made £1.45bn worth of acquisitions in the space.
Figure 9: Top Ten Trade Acquirers (Past Year)***
 ***UK Targets, Under £500m, Mergers, Acquisitions & Buyouts
If you are interested in digging into the data, or seeing some of the key selected private transactions- check out the full document below:
https://polestarcf.com/wp-content/uploads/2020/12/Polestar-Manufacturing-Spotlight-Report.pdf
The full report can be downloaded using the link in this post. Our data is sourced from a mixture of Capital IQ / Zephyr which are both reputable databases for M&A transactions across the globe. If you have any questions about our findings or would like to discuss how these trends may affect your business, feel free to reach out to us for a coffee.
Manufacturing production declined 7.1% YoY in Oct-20’, beating forecasts of an 8.1% drop. Still, this comes as the 19th consecutive decline amidst Brexit and COVID-19 induced uncertainty (Source: Office of National Statistics)