
In March 2023 we were eagerly awaiting the UK government’s white paper on AI, when it finally arrived, I went through and read it in its entirety. The key points in the white paper are:
When reading this whitepaper, I felt at the time it lacked data backing and clear structure in legislative reform, and that the strategy might halt innovation along the way. However, in the following months, GitHub, a leading open-source platform in software development tools, developed a technology that allows viewers to monitor innovation development within software development. This platform will be transformational for monitoring in all areas of data analysis, supporting innovation and contributing to global economic growth.

The platform allows users to measure and understand the global impact of developers, to address: previously, in a study commissioned by GitHub, it was found that a global issue was developing due to the lack of reliable and comprehensive data on trends in software and development. GitHub decided to build a platform with a dedicated webpage and raspatory, with data available to download dating back to 2020. The platform is updated quarterly renewing git pushes, developer stats, organisation insights, repository details, language preferences, licencing data, trending topics, and global and global collaborations within the global economy.
This platform will host a diverse audience of researchers, public policymakers, and developers. The platform is aimed at personnel involved in international development, public policy, and economic fields. The platform aims to remove barriers and democratise access to data, benefiting researchers without the need for third-party intervention. This will transform the knowledge of those within the sector to allow them to position themselves tactically to promote growth and development, whilst also helping give financial backers more of an insight into the pros and cons of businesses they invest in. In turn, this will boost productivity, financial backing, and the global economy, supporting the development of second and third-world countries and their income stream.

It has been found that a country’s open-source contributions correlate to international innovation and substantial economic growth. Access to online code and datasets allows advancing communities to establish a ground for learning through free learning tools and accessing more advanced systems has shown that if no country contributed to open-source development, the average GDP of a country would be 2.2% lower overall.
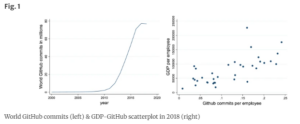
Source: Estimating the GDP effect of Open Source Software and its complementarities with R&D and patents: evidence and policy implications
These graphs demonstrate the correlation between increased open-source materials and the GDP per employee. The correlation trends towards GDP align with an active increase in open-source material. The new access to data that GitHub’s open-source platform brings will allow further development and understanding in the software space, producing more in-depth and compelling studies than before. These studies can help to develop policy which will help to foster and develop opportunities that can contribute to global economic growth.

At Polestar we are committed to utilising new software and technology to enhance our efficiency and knowledge. New tools such as the Innovation Graph will drive growth within all sectors and encourage innovation and advancement, with this growth new opportunities will arise for business owners that will lead to the need for financial advice. The swift development of platforms brings with it both new opportunities and new challenges. We will be interested to see how policy develops around the space and how tools such as Innovation Graph will supplement our work, I know in March of this year a tool analysing global tech development seemed almost out of sight.


